

Trying to understand that compute multiplier graph
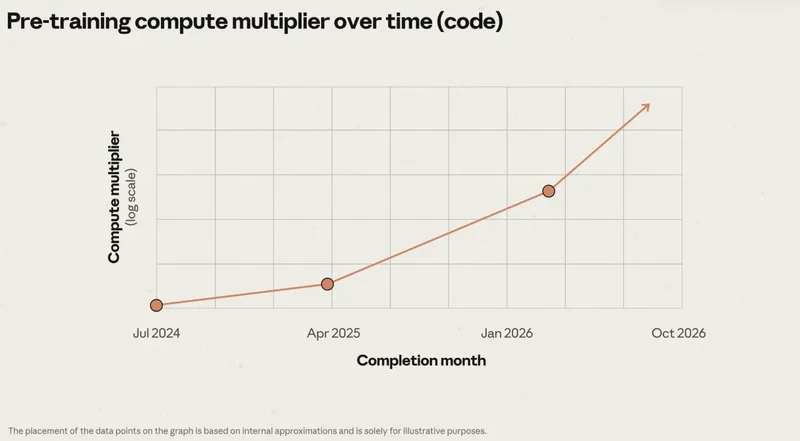
AI-generated summary An author attempts to interpret a compute multiplier graph from an Anthropic IPO roadshow video that displays four models including Claude 3.5 and Claude 4. The analysis suggests that the graph lines may represent a tenfold jump each, though the author notes uncertainty regarding these estimates.